| Measures of Central Tendency | 3x3 | 2x2 |
| Min | 10.83 | 2.79 |
| Q1 | 17.03 | 5.39 |
| Med | 19.76 | 6.33 |
| Q3 | 25.95 | 8.53 |
| Max | 49.35 | 36.95 |
| Measures of Spread | 3x3 | 2x2 |
| IQR | 8.92 | 3.14 |
| Range | 38.52 | 34.16 |
| Standard Deviation | 8.25 | 4.97 |
| Variance | 68.21 | 24.79 |
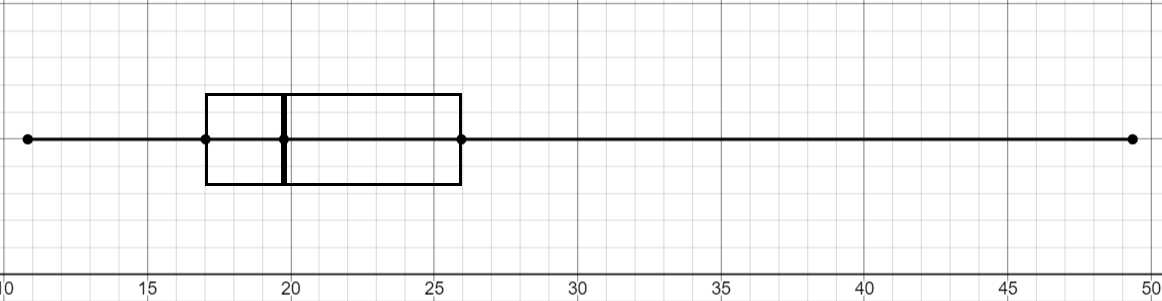
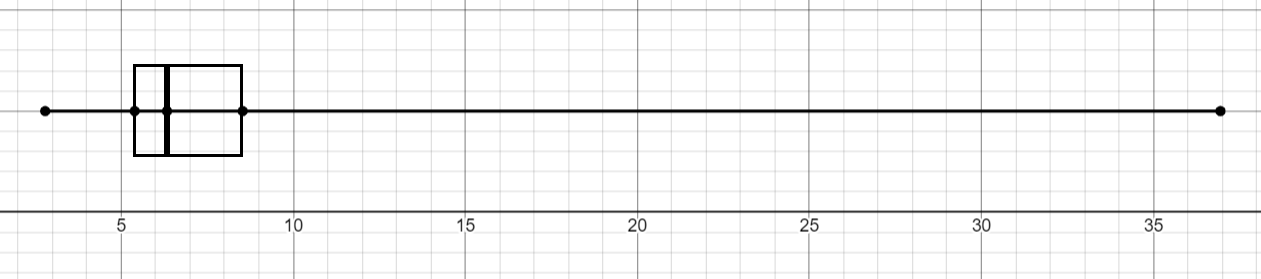
The box and whisker plots below clearly demonstrate the magnitude of the outlier values, especially for 2x2 where the box is miniscule, and one of the whiskers stretches really far. In both cases, there seems to be a positive skew, where there are much more lower values than there are higher values.
| Box and whisker plot for 3x3 solving times: |
 |
|---|
| Box and whisker plot for 2x2 solving times: |
 |
|---|
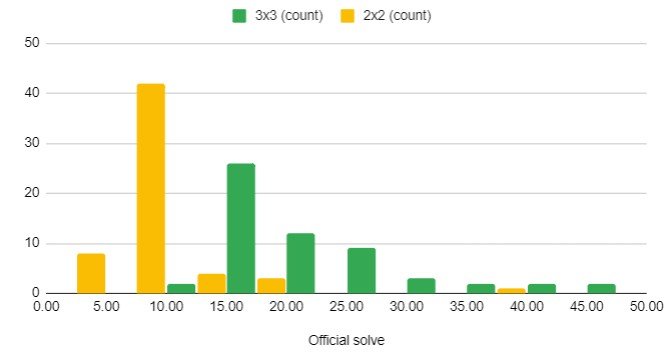
The histogram below shows the amount of values that exist within a certain interval. As stated above, this also shows a positive skew with the presence of much less higher values than there are lower values.
 |
|---|